

Most homeowners assume a lower price per watt automatically signals the better solar deal. It doesn't. Understanding the solar price per watt comparison requires knowing exactly what each installer has included in that number, because two quotes at the same dollar figure can represent very different systems. This article breaks down how the cost per watt metric is calculated, where variations come from, what benchmark ranges look like, and how to use this metric correctly when evaluating proposals.
Key takeaways
| Point | Details |
|---|---|
| Price per watt is a formula | Divide total installed cost by system wattage to get your $/W figure. |
| Scope affects the number | Permits, monitoring, and electrical upgrades may or may not be included in the $/W figure. |
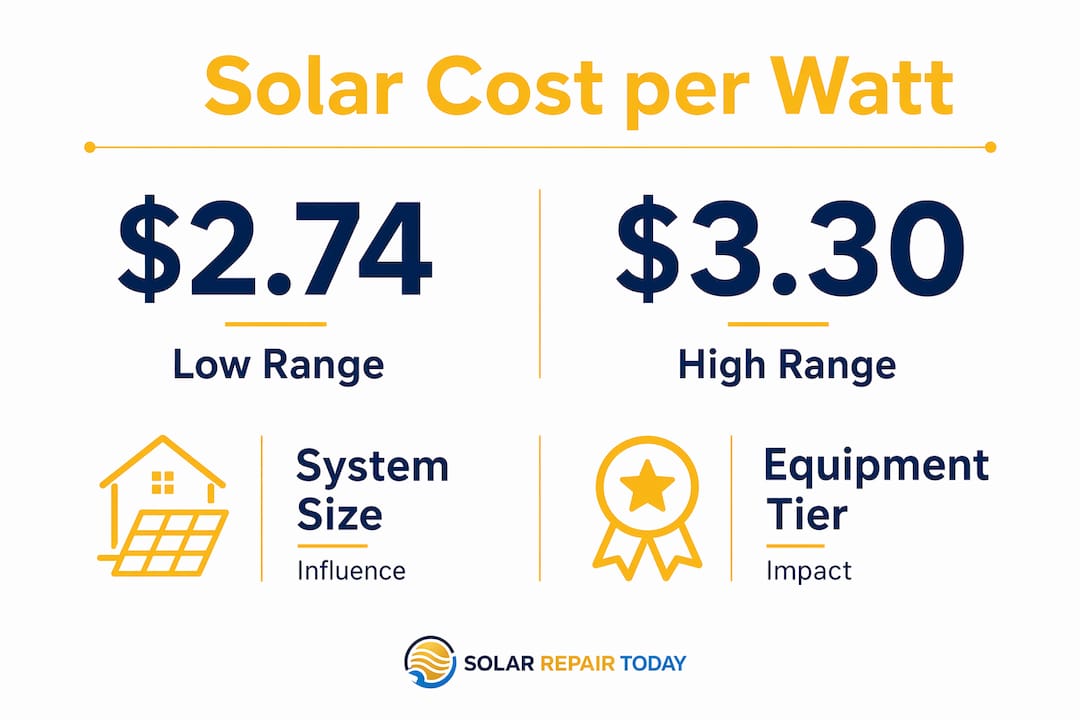
| Benchmark range exists | All-in residential solar typically falls between $2.74 and $3.30 per watt. |
| Lower $/W can mislead | A smaller number may reflect a smaller or incomplete scope, not a better price. |
| Cost per watt is one input | Financing terms, warranties, and production guarantees all affect long-term value. |
What solar price per watt comparison actually measures
The industry standard metric here is cost per watt ($/W), also referred to as price per watt. It is a normalization tool. It reduces the total price of a solar installation to a per-unit figure so that systems of different sizes can be compared side by side.
The formula is straightforward. Total installed cost divided by wattage gives you the $/W figure. For example, a system with a total installed cost of $24,000 and a capacity of 8,000 watts produces a price per watt of $3.00. That number tells you how much you paid for each watt of installed capacity.
What counts as "installed cost" matters enormously. In a properly scoped quote, the installed cost includes:
- Solar panels and inverter equipment
- Racking and mounting hardware
- Labor for installation
- Electrical work and wiring
- Permitting and inspection fees
- System monitoring setup
Not every installer includes all of these in the number they report. Some present a stripped-down equipment cost and call it a $/W figure. Others bundle in roofing work or battery backup. When you compare two proposals without verifying what each $/W figure covers, you are not comparing the same thing.
Pro Tip: Ask each installer for a line-item breakdown of their total installed cost. Then divide that verified total by the system size. This is the only way to calculate a legitimate $/W for comparison.
The unit of wattage also requires attention. System capacity is most commonly expressed in DC watts, which refers to the nameplate power output of the panels themselves. Some quotes may reference AC output or a different sizing method. Installers use different sizing metrics, and mixing these in a comparison will produce a distorted $/W number.
Factors that shift the $/W figure
Solar panel cost per watt is not a fixed number. Several factors push it up or down across different systems, installers, and markets.
System size has a direct effect. Larger systems tend to produce a lower $/W because fixed costs like permitting, design, and interconnection fees get spread across more watts. A 12 kW system almost always shows a lower $/W than a 4 kW system from the same installer, even though the total price is higher. This is a volume discount effect, not a quality signal.
Component choices move the number. Premium monocrystalline panels with high efficiency ratings cost more per watt than standard options. Microinverters typically add cost compared to string inverters. Battery backup adds significant cost. When a quote includes storage, its $/W figure will look higher than a panel-only installation, even if the installer's labor rate is identical.
Regional pricing differs meaningfully. DOE benchmark reports provide useful definitions but do not reflect local installation conditions. Markets with high labor costs, complex permitting processes, or steep roofline work will produce higher $/W figures than the national average. Hawaii and California consistently show higher installed costs per watt than states like Texas or Florida.
Here are the most common scope variables that alter $/W without affecting the core solar system value:
- Permit fees (vary significantly by municipality)
- Electrical panel upgrades (required by some utilities)
- Roof repairs or reinforcement before mounting
- Extended labor warranties
- System monitoring subscriptions
- HOA approval or architectural review costs
A quote that excludes a required electrical panel upgrade will look cheaper on a $/W basis. But you will pay for that upgrade later, separately. The effective price per watt, when all costs are counted, may end up identical or higher.
Real-world benchmark ranges for solar cost per watt
Residential solar cost comparisons benefit from a reference range. According to Tesla's cost breakdown data citing DOE figures, all-in residential solar systems currently run between $2.74 and $3.30 per watt. This range covers panels, inverters, installation labor, and standard permitting.
| System size | Estimated total cost | $/W range |
|---|---|---|
| 5 kW | $13,700 to $16,500 | $2.74 to $3.30 |
| 8 kW | $21,920 to $26,400 | $2.74 to $3.30 |
| 10 kW | $27,400 to $33,000 | $2.74 to $3.30 |
| 12 kW | $32,880 to $39,600 | $2.74 to $3.30 |
These figures represent standard residential installations without battery backup. A quote that falls well below this range warrants scrutiny. It may indicate lower quality components, an incomplete scope, or aggressive upfront pricing that shifts costs into a financing structure.
A quote below $2.50/W for a full-scope residential installation in a standard U.S. market should prompt questions, not celebration. The math rarely holds up under line-item inspection.
The DOE solar benchmark methodology is updated periodically and provides a framework for evaluating installer pricing. However, it reflects modeled costs, not actual transaction prices in your zip code. Use it as a floor, not a ceiling.
How to make accurate solar cost comparisons
The goal is an apples-to-apples comparison. That requires matching scope, sizing basis, and financing structure across every quote you evaluate. Comparing $/W quotes without verifying these three elements consistently produces misleading results.
Follow this process for each quote you receive:
- Identify the total installed cost. Get the full number before any incentives or tax credits. Installers sometimes present a post-incentive price, which obscures the real cost comparison.
- Confirm the system size in DC watts. This is the nameplate capacity of the panels. Verify it matches what appears on the equipment specification sheet.
- Calculate $/W yourself. Divide the total installed cost by the system size in watts. Reconciling implied installed cost by multiplying $/W back by the system size will catch any inconsistencies in how the installer quoted the project.
- Audit the line items. Request an itemized breakdown. Confirm permitting, monitoring, electrical work, and labor are all included.
- Check the equipment spec sheet. Verify panel brand, model, wattage, and efficiency. Two quotes at the same $/W using different panel tiers represent different long-term production potential.
Pro Tip: If an installer refuses to provide a line-item breakdown, that refusal is itself a red flag. Legitimate installers can explain every cost in their proposal.
Beyond the math, several other factors determine whether a solar quote is a sound investment. Reviewing production guarantees alongside the $/W figure reveals whether an installer stands behind their system's actual output. A lower $/W means nothing if the system produces 15% less energy than projected. Also check each installer's workmanship warranty period. Industry standard is 10 years. Shorter terms shift risk to the homeowner. And asking specific questions before signing any contract remains one of the most effective ways to surface problems early.
Beyond cost per watt: the full investment picture
Cost per watt is a normalization tool. It standardizes proposals for comparison. It does not measure quality, reliability, production output, or long-term value. Treating it as the primary decision factor leads to poor outcomes.
Consider these factors alongside $/W when making a final decision:
- Financing terms. A $0 down loan at 9.99% APR over 25 years will cost significantly more than a cash purchase at $3.10/W. The financing structure of your contract affects total lifetime cost more than a few cents per watt difference between quotes.
- Warranty coverage. Panel manufacturers typically offer 25-year product and performance warranties. Inverter warranties range from 10 to 25 years depending on type. Warranty terms directly affect the risk profile of your investment.
- Production guarantees. Some installers guarantee a minimum annual output and compensate you if the system falls short. This is materially different from a standard installation with no production accountability.
- Installer reputation and longevity. A 25-year warranty from a company that closes in 5 years is not a 25-year warranty. Check licensing, reviews, and years in operation.
- Solar installation cost breakdown. Understanding each cost component separately lets you identify which line items are negotiable and which reflect genuine system requirements.
The price of solar energy you ultimately pay is shaped by all of these variables. A slightly higher $/W from an installer with strong warranties, a credible production guarantee, and clear financing terms often delivers better value than a low $/W quote with gaps across these dimensions.
My take on where homeowners get this wrong
I've reviewed a lot of solar proposals, and the most consistent pattern I see is homeowners leading with $/W as if it's the only number that matters. They get three quotes, find the lowest price per watt, and treat that as the answer. It rarely is.
What I've learned is that $/W is most useful as a consistency check, not a ranking tool. If one quote comes in at $2.40/W and the others are at $3.05/W, the right response is not to celebrate the low number. It's to find out what's missing. Nine times out of ten, something is either excluded from the scope or the system is undersized for the home's actual energy use.
The other mistake I see frequently is comparing pre-incentive and post-incentive quotes in the same analysis. One installer shows you the total cost. Another shows you cost after the federal tax credit. The $/W figures look very different, but only because they're measuring different things. Always compare pre-incentive totals.
My honest advice: use $/W to filter out outliers and verify internal consistency in each proposal. Then make your decision based on equipment quality, warranty coverage, installer track record, and financing terms. The few cents per watt difference between solid quotes matters far less than getting the contract terms right.
— David
Get an independent review before you sign
If you are comparing solar proposals and want to verify the numbers before committing, Solarrepairtoday.com offers a structured review process built for exactly this situation.

Through the "Before You Sign" intake program, Solarrepairtoday reviews your proposal for pricing accuracy, equipment quality, system sizing, and financing terms. The solar proposal review service examines whether your quoted $/W reflects full installed cost or a stripped-down figure that leaves costs uncovered. The contract financing review identifies whether your loan or lease terms affect total lifetime cost in ways the installer didn't make clear. And the independent quote check service flags potential red flags across equipment specs, warranties, and production assumptions. Submit your proposal and get clarity before you sign.
FAQ
What does solar cost per watt mean?
Solar cost per watt ($/W) is the total installed price of a solar system divided by its capacity in watts. It normalizes pricing so systems of different sizes can be compared directly.
What is the average solar price per watt in 2026?
All-in residential solar systems currently range from $2.74 to $3.30 per watt, according to DOE-referenced data from Tesla. This covers panels, inverters, labor, and standard permitting costs.
Why do two solar quotes show different $/W figures?
Different $/W figures usually reflect differences in system size, included scope, equipment tier, or sizing methodology. A lower $/W is not automatically better if the quote excludes permitting, monitoring, or required electrical work.
How do I compare solar quotes using price per watt?
Request a line-item breakdown from each installer, confirm system size in DC watts, and calculate $/W yourself by dividing total pre-incentive cost by system wattage. Match scope across quotes before comparing numbers.
Is price per watt the most important factor in choosing solar?
No. Price per watt is a useful comparison tool, but financing terms, warranty coverage, production guarantees, and installer reliability all affect long-term value more than small $/W differences between competitive quotes.