

Most homeowners assume a bigger solar system automatically equals bigger savings. That assumption is increasingly wrong. Why solar system size matters comparison is not a simple "more panels, more money saved" equation, especially under billing rules like California's NEM 3.0 that pay low rates for power you export to the grid. The wrong system size, in either direction, can cost you thousands of dollars over the life of your contract. This guide breaks down exactly how solar system sizing works, what it does to your costs and savings, and how to evaluate your quotes before you sign anything.
Table of Contents
- How solar system size is determined by your energy needs
- The impact of system size on costs, savings, and return on investment
- Why bigger isn't always better: how net billing and export rates change value
- Physical constraints: panel size, roof space, and panel wattage comparisons
- How to compare different system sizes effectively before signing your solar contract
- Why chasing bigger solar systems can backfire under modern policies
- How Solar Repair Today helps you choose the perfect system size
- Frequently asked questions
Key Takeaways
| Point | Details |
|---|---|
| Align size with usage | Choose your solar system size based on your annual electricity consumption, not just roof size. |
| Beware oversizing | Oversizing without a battery under current net billing policies usually reduces financial returns. |
| Battery increases value | Pairing a properly sized battery lets you store cheap daytime solar for expensive evening use, improving savings. |
| Roof limits matter | Roof space and panel wattage determine how many panels you can practically install and the system’s power. |
| Compare with data | Review month-by-month production and tariff credits to fairly compare system sizes and payback times. |
How solar system size is determined by your energy needs
To understand why the size matters, first grasp how your energy use drives the ideal system size. Many homeowners focus on roof space first, but that is not the correct starting point.
System size should be based on your annual electricity consumption in kilowatt-hours (kWh), pulled directly from your last 12 months of utility bills. Roof area affects where panels physically go, but it does not tell you how much power you actually need to offset.
Key inputs that determine the right system size:
- Annual kWh usage. Total electricity consumed over 12 months is the primary number. Find it on each bill and add up the year.
- Roof orientation and tilt. A south-facing 30-degree pitched roof produces more per panel than a flat east-facing surface, which changes how many panels you need to hit your target output.
- Local peak sun hours. Phoenix gets roughly 6.5 peak sun hours per day. Seattle gets closer to 4. The same 8 kW system produces very different annual output in each city.
- Future load changes. Planning to add an EV charger or a pool pump? That adds 2,000 to 5,000 kWh per year and should be factored into sizing now. Retrofitting later is more expensive.
Understanding the solar quote factors that inform a proposal helps you verify whether an installer did this math correctly or just dropped in a standard system size.
The impact of system size on costs, savings, and return on investment
Now that you know how system size is selected, learn how it directly affects your investment and savings. The relationship is not linear. Doubling the system size does not double your savings.
Solar system size in kilowatts directly determines how much energy the system generates and, therefore, how much grid power you avoid buying. A system that is too small keeps you buying expensive grid power. A system that is too large means you paid for capacity you cannot fully use.
Here is how the math plays out across three common scenarios:
- Undersized system (covers 60% of usage). Lower upfront cost, but you still buy 40% of your power from the grid at full retail rates. Savings are modest. Payback period stretches out.
- Right-sized system (covers 90–100% of usage). Highest savings-to-cost ratio. Minimal grid dependency. Fastest payback in most cases.
- Oversized system (covers 130%+ of usage). High upfront cost. Excess production exported at low utility rates. The additional panels often earn back cents on the dollar compared to what they cost.
"If a system is too small, you remain dependent on the grid, while if it's too large, you may pay for capacity you can't fully use." — Tasmania Safer Solar
Pro Tip: Calculate simple payback as net system cost (after the 30% federal tax credit) divided by your first-year electricity savings. A well-sized system typically shows a payback period of 7 to 10 years. If a proposal shows payback over 12 years, the sizing or pricing likely needs a second look.
For a full breakdown of what drives your upfront number, review the installation cost breakdown before comparing quotes.
Why bigger isn't always better: how net billing and export rates change value
Understanding costs and ROI leads to grasping how new billing rules affect the true value of system size. This is where many proposals fall apart.
Under California's NEM 3.0 (Net Energy Metering 3.0), solar energy exported to the grid during peak production hours (typically 10 a.m. to 3 p.m.) earns the homeowner very low export credits, often around 5 to 10 cents per kWh. But that same household buys power back from the grid in the evening at 35 to 45 cents per kWh.
Key implications for system sizing under net billing programs:
- Oversizing without storage creates a value mismatch. You produce cheap midday power, export it at low rates, then buy expensive evening power back.
- Self-consumption is now the priority. Power used directly from your panels, or from a battery charged during the day, avoids the grid entirely.
- Battery storage changes the equation. A battery captures midday surplus and discharges it at night, replacing expensive grid power rather than selling cheap solar.
- Sizing to 100–110% of usage with storage provides better returns than sizing to 130% without storage under these billing structures.
"Oversizing a solar array without pairing it with storage can materially reduce savings because exported energy is credited at much lower midday rates than the higher rates homeowners pay during evening peak hours."
If your installer is in California or another state moving toward avoided cost net billing, battery storage value becomes a central part of your sizing decision, not an optional add-on.
Physical constraints: panel size, roof space, and panel wattage comparisons
Beyond billing, physical realities like roof space and panel wattage affect the achievable system size. Not every roof can hold the ideal number of panels.

Higher wattage panels reduce the number of physical modules needed to reach your target system size. On a roof with limited usable area, that distinction matters.
Solar system size comparison chart: panel wattage vs. panel count for a 10 kW system
| Panel wattage | Panels needed (10 kW) | Approx. roof area needed |
|---|---|---|
| 350W | 29 panels | ~520 sq ft |
| 400W | 25 panels | ~450 sq ft |
| 500W | 20 panels | ~360 sq ft |
| 600W | 17 panels | ~305 sq ft |
| 635W | 16 panels | ~288 sq ft |
Physical factors that can cap your system size regardless of energy needs:
- Usable roof area. Setback requirements, roof edges, and valleys reduce the area available for panels.
- Shading. Chimneys, trees, and neighboring structures reduce output and may require microinverters or power optimizers, adding cost.
- Structural load capacity. Older roofs may not support the added weight of a full-size system without reinforcement.
- Roof vents and mechanical equipment. HVAC units, skylights, and plumbing vents take up prime panel space.
Pro Tip: If your roof limits you to a smaller system than your energy use requires, prioritize higher-wattage panels to maximize output per square foot. The added per-panel cost is usually offset by the production gain. Verify this trade-off against the panel wattage and roof space details in any proposal you receive.
How to compare different system sizes effectively before signing your solar contract
Armed with knowledge about size, billing, and roof limits, here is how to critically compare quotes and system sizes before you commit.
Most installer proposals show annual production totals. Annual totals hide important seasonal mismatches. A system that looks adequate on paper may overproduce in summer while dramatically underproducing in winter months, depending on your climate and usage patterns.
Homeowners should ask installers for month-by-month production and credit estimates based on their actual current tariff, not an outdated net metering assumption.
Steps to compare solar system sizes across multiple quotes:
- Pull your actual 12-month usage. Get kWh consumed each month, not just total annual use. Seasonal variation matters.
- Compare monthly production estimates to monthly consumption. Look for months where the system significantly overproduces or underproduces.
- Verify the tariff assumption. Ask each installer which specific rate plan and export credit rate they used in their savings estimate.
- Calculate payback for each proposal. Net cost after incentives divided by first-year savings gives you a consistent comparison point across different system sizes and prices.
- Check for degradation. Solar panels lose roughly 0.5% output per year. Over 25 years, that is about a 12% reduction. Ask whether the proposal's savings projections account for this.
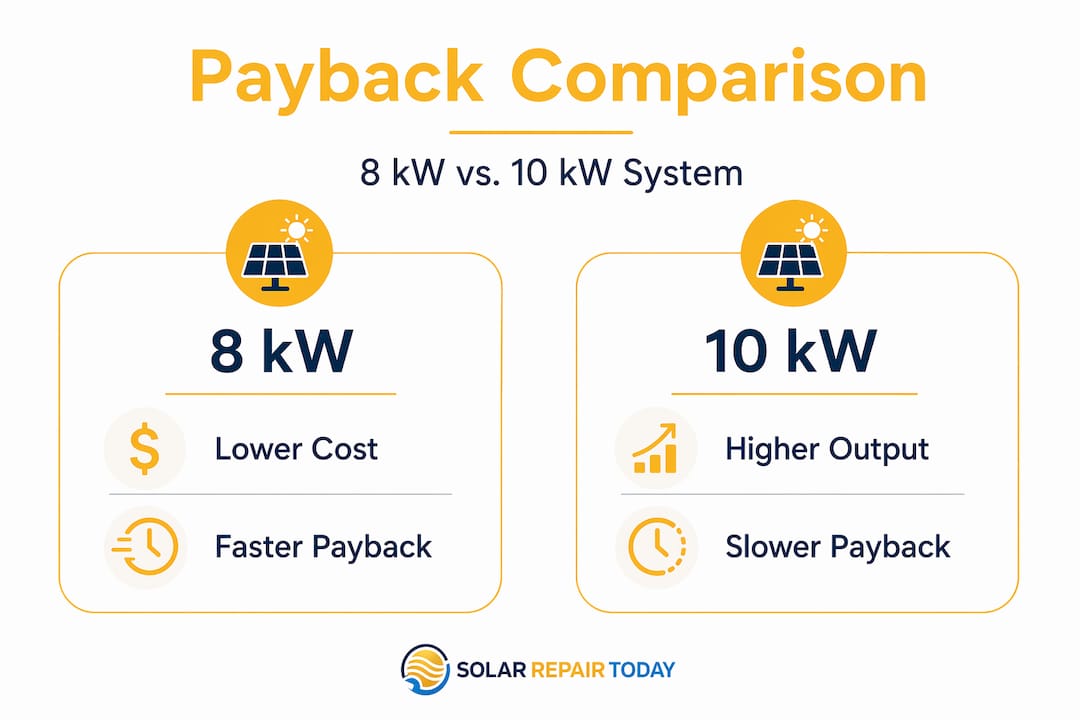
Sample payback comparison: 8 kW vs. 10 kW system
| System size | Gross cost | After 30% ITC | Year 1 savings | Simple payback |
|---|---|---|---|---|
| 8 kW | $28,000 | $19,600 | $2,100 | 9.3 years |
| 10 kW | $34,500 | $24,150 | $2,400 | 10.1 years |
The 10 kW system in this example produces more but yields a longer payback because the extra production earns low-value export credits rather than replacing high-cost grid power. This is precisely why a solar system size comparison needs to account for billing structure, not just output.
Submitting your proposal to a solar proposal review service can surface these discrepancies before you sign. When comparing multiple bids, a service that helps compare solar quotes by applying consistent assumptions across proposals gives you a cleaner read on which size and price is actually competitive.
Why chasing bigger solar systems can backfire under modern policies
The solar industry operated under a straightforward premise for years: size your system to cover 110% or even 120% of your annual usage, account for future load growth, and let the utility buy back whatever you don't use at near-retail rates. That model worked well under traditional net metering.
It no longer works in many states. The right system size under NEM 3.0 and similar avoided-cost billing programs maximizes self-consumption, not total production. That is a fundamental shift, and many installers are still sizing systems using assumptions built for the old billing world.
The uncomfortable reality: an oversized system without battery storage under NEM 3.0 can actually produce a worse 25-year financial outcome than a right-sized system. The additional kilowatt-hours generated export at 5 to 10 cents while the panels and inverter capacity that produced them cost retail dollars.
The correct approach is to treat battery storage insight as part of the sizing conversation from day one. A smaller system paired with storage often outperforms a larger system without storage because stored energy replaces expensive evening grid power instead of generating low-value exports.
Sizing for anticipated future loads, like an EV charger you plan to add in two years, still makes sense. But sizing speculatively beyond known near-term loads, just because a larger system sounds better, does not hold up under current billing math.
How Solar Repair Today helps you choose the perfect system size
System sizing errors are among the most common and costly issues found in solar proposals. Before you sign, it is worth knowing whether the size on your quote is actually right for your home, your utility's current billing rules, and your financial goals.

Solar Repair Today's "Before You Sign" intake program reviews your proposal, quote, and utility bill to verify system sizing, analyze battery options, and flag inconsistencies in savings estimates. A solar proposal review confirms whether your installer sized correctly for your actual consumption and local tariff. The financing review breaks down loan terms, interest costs, and incentive structures so you understand your real net cost. For homeowners considering storage, the battery proposal review evaluates whether the battery size matches your self-consumption goals. One independent review before signing can prevent years of underperformance.
Frequently asked questions
How do I determine the right solar system size for my home?
Calculate your annual electricity usage from the last 12 months of bills, then size your system to offset 90–110% of that total. System size should be based on annual kWh consumption, not roof area, and battery storage can justify sizing toward the higher end of that range.
Why isn't a bigger solar system always better under NEM 3.0?
Oversizing without storage causes excess midday solar to export at low avoided-cost rates around 5 to 10 cents per kWh, while you still buy back evening power at 35 to 45 cents per kWh, reducing overall savings.
How does adding battery storage change optimal solar system size?
With battery storage, sizing at 100–110% of your annual usage makes sense because the battery captures midday surplus and discharges it during expensive evening hours, replacing high-cost grid power instead of exporting at low credit rates.
What role does roof size and panel wattage have in solar system sizing?
Roof size limits the number of panels you can physically install, while higher wattage panels reduce the panel count needed to reach your target system size, which matters on small or obstructed roofs where total space is the binding constraint.
How can I compare solar system sizes and payback when reviewing quotes?
Ask for month-by-month production and credit estimates under your actual current tariff, then calculate payback as net cost after incentives divided by first-year savings. This method creates an apples-to-apples comparison across proposals with different system sizes and price points.