
Solar panel underperformance is defined as a sustained, measurable drop in electricity generation that falls significantly below the expected output for your system's size, location, and orientation. Most homeowners don't notice the signs solar panels underperforming until months of lost savings have already accumulated. Tools like Enphase EnLighten, SolarEdge monitoring apps, and benchmarking calculators such as PVWatts and PVGIS make early detection straightforward. This guide covers nine specific indicators, the causes behind each, and how to confirm whether you have a real fault or a reporting error.
1. Signs solar panels underperforming: output below benchmark estimates
The most reliable indicator of a solar performance problem is a consistent gap between your actual kWh production and the output predicted by PVWatts or PVGIS for your system's size, tilt, and location. These tools model expected generation based on historical weather data and system specifications. They give you a defensible baseline, not a rough guess.
Investigating when output drops below 75 to 80% of the PVGIS estimate is the standard threshold used by solar technicians. A year-over-year decline of 5% or more also warrants investigation. Normal panel degradation runs at only 0.5 to 1% per year, so anything steeper points to a fault rather than aging.

Pro Tip: Pull your monthly kWh totals from your inverter or monitoring app and compare them against PVWatts estimates for the same months. A spreadsheet with 12 months of data will show you whether the gap is growing.
| Comparison metric | What it signals |
|---|---|
| Output below 75–80% of PVGIS estimate | Likely fault requiring investigation |
| Year-over-year drop of 5%+ | Fault event, not normal degradation |
| Gradual 0.5–1% annual decline | Normal panel aging |
| Sudden steep single-month drop | Electrical or inverter fault |
2. Sudden steep drops in production
A sharp, sudden decline in output on a clear day is one of the clearest indicators of poor solar panel output. Classifying drop patterns helps focus troubleshooting: sudden steep drops typically point to electrical or inverter faults, while gradual declines suggest shading, soiling, or normal aging. This distinction saves significant diagnostic time.
If your system produced 30 kWh on a sunny day last month and is now producing 18 kWh under identical conditions, start with the inverter and breaker panel before looking at the modules themselves. Gradual declines over weeks or months call for a different checklist.
3. Individual panels showing zero or near-zero output
Panel-level monitoring through Enphase or SolarEdge systems makes it possible to isolate a single underperforming panel within minutes. Enphase systems with grey or unknown panel status typically indicate microinverter failure or powerline communication loss. One grey panel usually means a single inverter or communication fault. Multiple grey panels in a row often point to a tripped AC branch circuit breaker rather than simultaneous inverter failures.
This distinction matters because the fix is completely different. A tripped breaker takes 30 seconds to reset. A failed microinverter requires a replacement unit. Checking your breaker panel first is always the right first step when multiple panels go offline at once.
4. Inverter error codes and warning lights
Your inverter is the system's primary diagnostic interface. String inverters from manufacturers like SMA, Fronius, and Growatt display error codes that correspond to specific fault categories including grid faults, isolation failures, and thermal throttling. Ignoring these codes is one of the most common reasons solar panel performance issues go unresolved for months.
Interpreting inverter error codes correctly requires matching the code to the manufacturer's documentation. Some codes indicate temporary conditions like grid voltage fluctuations. Others, such as isolation fault codes, indicate wiring problems that require immediate professional attention. Checking the inverter display or app daily takes less than a minute and catches faults early.
Pro Tip: Download your inverter manufacturer's fault code reference sheet and keep it accessible. SMA, Fronius, and Enphase all publish these documents publicly. Cross-reference any active code before calling a technician.
Understanding why solar inverter faults occur and how to prevent them gives you a significant advantage in catching problems before they compound.
5. Visible physical damage to panels
Physical inspection is a low-tech but high-value diagnostic step. Module reliability data from Kiwa PVEL's 2026 scorecard shows that 45% of tested bills of materials experience delamination failures, and 26% face breakage issues. These are not rare edge cases. They are common failure modes that directly reduce output.
Look for these physical indicators during a ground-level or rooftop inspection:
- Cracking or microcracks: Often invisible to the naked eye but detectable through electroluminescence imaging
- Delamination: Bubbling or separation between the glass and encapsulant layers
- Discoloration: Yellowing or browning of cells, indicating heat stress or moisture ingress
- Burn marks: Dark spots on the cell surface, often caused by hotspots from cell mismatch or shading
"Persistent underperformance despite normal environmental checks may indicate module defects like delamination or microcracking rather than just dirt or shade." — Solarrepairtoday diagnostic insight
6. Soiling, shading, and obstructions
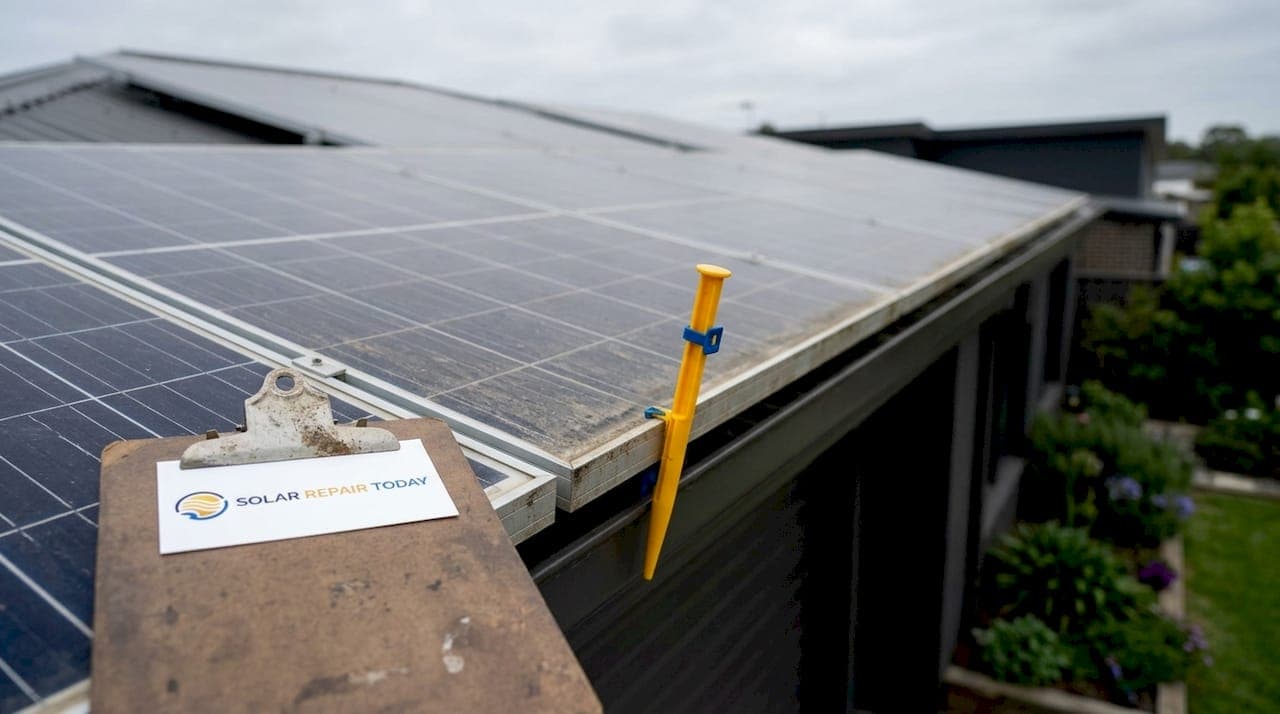
Dirt, bird droppings, pollen, and industrial residue on panel surfaces cause measurable energy loss. A 2026 peer-reviewed study found that soiling causes an average 22.18% annual energy loss, including thermal effects on cells. On a 25 kWp system, that translates to nearly $1,900 in lost value per year. Regular cleaning is not optional maintenance. It is a direct financial decision.
Shading from newly grown trees, added structures, or neighboring buildings creates a different problem. Unlike soiling, shading can cause disproportionate output loss because of how panels are wired in series strings. A single shaded cell can reduce the output of an entire string. Check for new shading sources at least twice a year, particularly in spring when tree canopies fill out.
7. High temperatures and thermal throttling
Heat reduces solar panel efficiency. Most crystalline silicon panels lose approximately 0.3 to 0.5% of output per degree Celsius above 25°C. During heatwaves, this adds up quickly. Field data from a 10 kW system shows heatwave conditions can reduce solar generation by roughly 15%, with inverters adding an additional 3 to 8% peak output loss through thermal throttling. That means a system rated at 10 kW could effectively deliver 7.7 kW or less on the hottest days.
Inverter placement directly affects thermal throttling. An inverter mounted in a poorly ventilated garage or in direct sunlight will throttle output more aggressively than one mounted in a shaded, ventilated location. If your summer output drops more than expected, check the inverter's operating temperature before assuming panel failure.
8. Monitoring data that doesn't match your utility bill
One of the most overlooked low solar panel production causes is a monitoring system error rather than an actual generation fault. Enphase panel-level data has been documented showing near-zero production on individual panels while overall CT sensor readings confirmed normal generation. The panels were producing normally. The monitoring gateway was reporting incorrectly.
Cross-checking your inverter's local display data against your utility bill is the most reliable way to distinguish real underperformance from a reporting glitch. If your utility bill shows normal net metering credits but your app shows low production, the app is likely the problem. Learning how to read solar production monitoring data correctly prevents unnecessary service calls and misdiagnosis.
9. Wiring and connector degradation
Corroded or failed MC4 connectors are a common and underdiagnosed cause of output loss. These connectors join panel strings together and are exposed to UV radiation, temperature cycling, and moisture over years of outdoor use. Degraded connectors increase resistance in the circuit, which reduces current flow and output without triggering obvious error codes.
Signs of connector issues include intermittent output drops that don't correlate with weather, localized heating detected during thermal imaging, and string-level output that is consistently lower than comparable strings on the same roof. A qualified solar technician can test connector resistance with a multimeter and identify degraded connections before they cause complete string failure. String-level monitoring makes these patterns visible in the data before they become critical faults.
Electroluminescence imaging is the definitive tool for detecting hidden module-level defects including microcracks and potential-induced degradation (PID). Visual inspection and thermal imaging miss defects that EL imaging catches reliably. For warranty claims or pre-purchase inspections, EL imaging is the standard of evidence.
Key takeaways
Identifying solar panel underperformance requires comparing real output against PVWatts or PVGIS benchmarks, inspecting for physical damage and soiling, and cross-checking monitoring data against utility bills to separate genuine faults from reporting errors.
| Point | Details |
|---|---|
| Benchmark comparison first | Output below 75–80% of PVGIS estimates or a 5%+ annual drop signals a fault. |
| Soiling causes major losses | Average annual energy loss from soiling reaches 22.18%, costing nearly $1,900 on a 25 kWp system. |
| Multiple panels offline | Check AC branch breakers first before assuming simultaneous inverter failures. |
| Monitoring errors are common | Cross-check app data against utility bills to confirm whether underperformance is real. |
| EL imaging for hidden defects | Electroluminescence imaging is the only reliable method for detecting microcracks and PID. |
What I've learned from reviewing underperforming solar systems
Most homeowners I work with come in convinced their panels are failing. After reviewing the data, the actual fault rate is lower than you'd expect. The more common problem is that no one ever established a realistic performance baseline at installation. Without a PVWatts or PVGIS comparison, there is no way to know whether a system is underperforming by 5% or 30%.
The second pattern I see repeatedly: homeowners trust their monitoring app completely. Monitoring apps are useful, but they report communication status as much as they report generation status. A grey panel in Enphase EnLighten does not always mean a dead microinverter. It sometimes means a gateway communication issue. Treating every grey panel as a hardware failure leads to unnecessary service calls and replacement costs.
My practical advice: run a solar system maintenance schedule that includes a quarterly benchmark comparison, a biannual physical inspection, and an annual review of your utility bills against your monitoring data. If those three checks consistently show a gap, then you have a real problem worth investigating with professional diagnostic tools including thermal and EL imaging.
Don't wait for your installer to flag the issue. They rarely do.
— David
Get a professional review of your solar system's performance
If your system's output doesn't add up and you're not sure whether the problem is a panel fault, an inverter issue, or a monitoring error, Solarrepairtoday provides independent diagnostic reviews for homeowners.
Through the Before You Sign intake program, you can submit your monitoring data, utility bills, or installer proposal for an expert review covering system sizing, equipment condition, and performance benchmarks. If you've already received a repair or upgrade quote, a solar proposal review confirms whether the pricing and recommended work are justified. For homeowners weighing financing options on a repair or system upgrade, the contract financing review identifies red flags before you sign. Independent review costs far less than an unnecessary system replacement.
FAQ
What percentage drop signals a solar performance problem?
A consistent output below 75 to 80% of your PVGIS or PVWatts estimate, or a year-over-year drop of 5% or more, indicates a likely fault. Normal panel degradation runs at only 0.5 to 1% per year.
How do I check if my solar panels are actually failing?
Compare your inverter's kWh production data against PVWatts estimates for the same period, then cross-check against your utility bill. If both sources show a sustained gap, the underperformance is real rather than a monitoring error.
Can dirt on panels really cause significant output loss?
Yes. A 2026 peer-reviewed study found soiling causes an average 22.18% annual energy loss, including thermal effects on cells. Regular cleaning directly recovers that lost generation.
What does a grey panel in Enphase EnLighten mean?
A grey or unknown panel status in Enphase EnLighten typically indicates a microinverter failure or a powerline communication loss. Multiple grey panels in sequence usually point to a tripped AC branch breaker rather than multiple inverter failures.
When should I get professional diagnostic imaging done?
Schedule electroluminescence or thermal imaging when output remains low after ruling out soiling, shading, monitoring errors, and breaker issues. EL imaging is the only reliable method for detecting microcracks and potential-induced degradation, and it provides the documentation needed for warranty claims.