

Testing solar battery health capacity is the process of measuring your battery's usable energy output against its original rated capacity to determine real-world performance and remaining lifespan. The industry standard metric for this is State of Health (SoH), calculated as: SoH = (Current Maximum Capacity ÷ Rated Capacity) × 100%. Tools like the Victron Battery Monitor, digital multimeters, and dedicated load testers make this process accessible to homeowners without professional equipment. Understanding where your battery stands on the SoH scale directly determines whether your system is performing as expected or quietly losing value.
What tools do you need to test solar battery health capacity?
Four core tools cover the full range of battery capacity diagnostics for residential solar systems. Each serves a distinct function, and skipping any one of them limits the accuracy of your results.
| Tool | Function | Best For |
|---|---|---|
| Digital multimeter | Measures open-circuit voltage | Quick baseline voltage check |
| Load tester | Applies a controlled current draw | Detecting capacity loss under real conditions |
| Battery monitor (e.g., Victron Battery Monitor) | Tracks amp-hours in and out | Continuous SoH and SoC tracking |
| Timer or stopwatch | Records discharge duration | Runtime comparison tests |
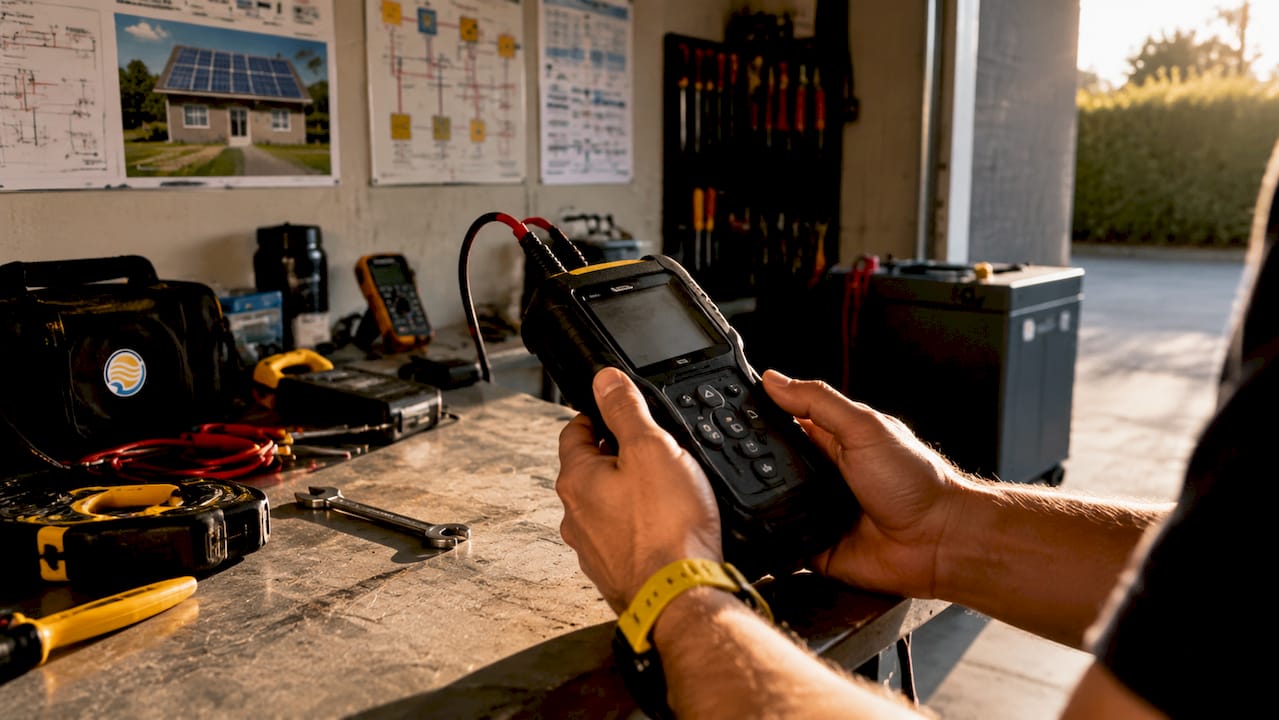
A digital multimeter costs under $30 and handles basic voltage readings. A load tester, such as those made by Schumacher Electric or Midtronics, applies a realistic current draw to expose weaknesses that resting voltage conceals. Battery monitors like the Victron Battery Monitor or Renogy BT-2 go further by logging cumulative amp-hour data, which is the foundation of any accurate solar battery health analysis.
Pro Tip: If you own a lithium iron phosphate (LiFePO4) battery, prioritize a battery monitor over a multimeter. LiFePO4 cells maintain a nearly flat voltage curve across most of their charge range, making voltage alone almost useless as a capacity indicator.
For homeowners who want a deeper read on how monitoring software fits into the broader picture, the role of monitoring apps in solar decision-making is worth reviewing before purchasing any hardware.
How to perform a controlled discharge test
The controlled discharge test is the most reliable method to evaluate solar battery capacity in a field setting. Using a consistent load and a full discharge cycle for SoH estimation reduces measurement noise and improves reliability compared to day-to-day runtime comparisons.
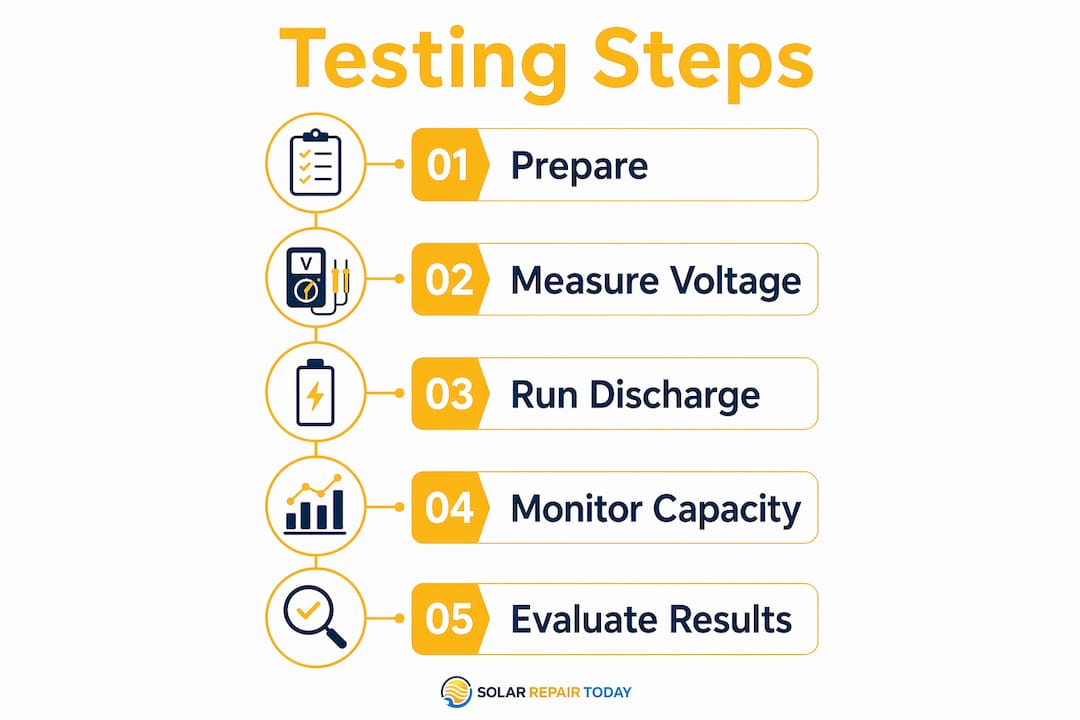
Follow these steps precisely:
- Fully charge the battery. Bring it to 100% SoC using your normal solar charger or inverter-charger. Do not start the test from a partial charge.
- Connect a known, stable load. Use a resistive load or an inverter powering a fixed appliance. Record the exact wattage or amperage being drawn.
- Start your timer and battery monitor simultaneously. The Victron Battery Monitor will begin counting consumed amp-hours from the moment current flows.
- Monitor voltage at regular intervals. Check every 30 to 60 minutes. For lead-acid batteries, watch for the low-voltage cutoff around 10.5V to 10.8V. For LiFePO4, the BMS will typically disconnect at 2.5V per cell.
- Record total amp-hours consumed at cutoff. The Victron Battery Monitor displays this directly. This figure is your measured usable capacity.
- Calculate SoH. Divide measured capacity by the battery's rated capacity and multiply by 100. A 100Ah battery that delivers 82Ah has an SoH of 82%.
A practical runtime check reinforces this result. A 20Ah LiFePO4 battery powering a 10W load should run approximately 25 hours. If runtime falls below 15 hours, that signals notable capacity loss worth investigating further.
Pro Tip: Run the discharge test at a consistent C/5 or C/10 rate (one-fifth or one-tenth of rated capacity in amps) for the most accurate results. Discharging too fast generates heat and artificially deflates your capacity reading.
How do BMS and SoH metrics automate capacity testing?
A Battery Management System (BMS) does more than protect cells from overcharge and over-discharge. Modern BMS units perform automated SoH calculations by comparing measured capacity from reference charge and discharge cycles against the battery's original rated specification. This removes the need for manual testing every time you want a health snapshot.
SoH and State of Charge (SoC) are not the same metric, and confusing them leads to bad decisions:
- SoC tells you how full the battery is right now, expressed as a percentage of its current maximum capacity.
- SoH tells you what percentage of the original rated capacity that current maximum actually represents.
A battery at 90% SoC but 75% SoH is only delivering 75% of what you originally paid for, even though it reads "nearly full."
BMS alert thresholds vary by manufacturer, but a common warning triggers when SoH drops below 85%. End-of-life is typically flagged at 70% to 80% SoH. Battery warranties commonly guarantee 70% SoH retention after 10 years, subject to cycle count, depth of discharge, and operating temperature conditions. Knowing your BMS threshold relative to your warranty terms tells you exactly when a replacement claim becomes valid.
One critical limitation: different battery monitors and software read different capacity registers, and dashboard app readings frequently mismatch BMS LCD values. Always treat the BMS direct reading as the primary data source. App dashboards are useful for trend tracking, not absolute capacity figures.
What are common mistakes to avoid when testing battery health?
Most testing errors come from shortcuts that produce misleading results. These are the mistakes that cause homeowners to either replace a healthy battery or miss a failing one.
- Relying on voltage alone. Battery voltage can appear healthy at rest but collapse under load, masking true capacity degradation. A resting voltage check tells you SoC, not SoH.
- Testing immediately after charging. Surface charge inflates voltage readings for up to two hours after a charge cycle ends. Allow the battery to rest before taking any measurements.
- Skipping the full reference cycle. Many perceived capacity losses are actually SoC calibration drift, not real degradation. A full charge-to-discharge reference cycle resets the SoC counter and gives the BMS accurate data to work from.
- Using inconsistent loads. Variable loads produce variable results. Fix your load at a known wattage for every test so results are comparable over time.
- Ignoring cell imbalance alerts. A BMS that flags individual cell voltage deviations is signaling a problem that a whole-pack voltage reading will not show. Cell imbalance accelerates degradation in the weaker cells.
Pro Tip: Schedule your capacity test after a period of normal system use, not immediately following an extended outage or abnormal discharge event. Abnormal conditions skew the baseline and make trend comparisons unreliable.
If your panels are also underperforming, that affects how fully the battery charges before each test. Reviewing the signs your solar panels are underperforming before running a battery test rules out upstream variables.
How to interpret test results and plan next steps
Test results fall into three clear categories, each with a defined response path.
Healthy battery (SoH above 85%). No immediate action required. Schedule the next capacity test in 12 months. Document the result as your baseline for trend analysis. A battery holding above 85% SoH is performing within normal parameters and should meet its warranty obligations.
Moderate degradation (SoH between 70% and 85%). The battery is aging but functional. This range warrants closer monitoring every six months. Check your warranty terms. Battery warranties often guarantee minimum retained capacity at year or cycle milestones, and a reading in this range may qualify for a warranty service call depending on how many years or cycles have elapsed.
End-of-life range (SoH below 70%). Replacement planning starts here. SoH represents irreversible aging. No recalibration or maintenance restores lost capacity. At this point, the battery is delivering less than 70% of its original storage, which directly reduces your solar self-consumption rate and backup runtime.
Practical next steps by result category:
- Document every test result with date, load used, measured amp-hours, and calculated SoH.
- Compare results year over year to identify degradation rate. A battery losing more than 3% to 4% SoH per year is degrading faster than typical.
- Cross-reference your warranty document for cycle count and calendar year thresholds before contacting the manufacturer.
- For batteries approaching 70% SoH, get an independent proposal review before committing to a replacement purchase. Installer quotes for replacements vary significantly, and a second opinion on sizing and pricing protects your investment.
For context on what real solar battery savings look like when a system is properly maintained, case studies from 2026 show measurable differences between systems with regular capacity testing and those without.
Key takeaways
Accurate solar battery capacity testing requires a full controlled discharge cycle, a calibrated battery monitor, and SoH interpretation against your warranty thresholds, not just a voltage reading.
| Point | Details |
|---|---|
| SoH is the core metric | Calculate SoH by dividing current measured capacity by rated capacity, then multiplying by 100. |
| Controlled discharge beats voltage checks | Discharge to cutoff with a fixed load and measure amp-hours consumed for accurate capacity data. |
| BMS automates SoH tracking | Modern BMS units flag degradation alerts at 85% SoH and end-of-life thresholds at 70% to 80%. |
| SoC drift mimics capacity loss | Run a full reference cycle before concluding the battery has degraded to avoid premature replacement. |
| Warranty thresholds define replacement timing | Most warranties guarantee 70% SoH after 10 years; test results below this threshold support a claim. |
What I've learned from watching homeowners misread their batteries
The most common mistake I see is homeowners treating a low SoC reading as proof of a failing battery. A system that "doesn't last through the night" is not automatically a degraded battery. It could be SoC drift, a misconfigured inverter, or a panel output issue that never fully charges the battery in the first place. The battery gets blamed because it's the most visible symptom.
The Victron Battery Monitor changed how I think about this problem. When you have cumulative amp-hour data logged over weeks, you can see whether the battery is actually delivering less capacity or whether the charge input has dropped. That distinction matters enormously before spending several thousand dollars on a replacement.
I also see homeowners trust dashboard app readings without verifying them against the BMS. The mismatch between app data and BMS direct readings is real and documented. Treat the BMS LCD as ground truth. Use the app for trend spotting, not for making replacement decisions.
Annual capacity testing is not optional if you want to manage your system cost-effectively. A battery that drops from 95% to 91% SoH in one year is on a normal trajectory. One that drops from 91% to 82% in the same period needs investigation. You cannot see that trend without consistent, documented test results. Start now, even if your battery is new, so you have a baseline to compare against.
— David
Get an independent review before replacing your battery

If your test results show degradation or your system is not performing as expected, Solarrepairtoday offers professional battery proposal reviews before you commit to a replacement or upgrade. Through the "Before You Sign" intake program, you can submit your current system specs, installer quote, or test data for an independent assessment of pricing, sizing, and whether a replacement is actually warranted. Solarrepairtoday reviews battery backup proposals and flags red flags in equipment specs, warranty terms, and financing structures. Get a solar battery proposal review before signing anything.
FAQ
What is State of Health in a solar battery?
State of Health (SoH) measures a battery's current usable capacity as a percentage of its original rated capacity. A battery with 80% SoH delivers 80% of what it did when new.
How often should I test my solar battery capacity?
Annual testing is the standard for residential solar batteries. If your system shows signs of reduced backup runtime or slower recharge, test immediately rather than waiting for the scheduled cycle.
Can I check solar battery health with just a multimeter?
A multimeter measures resting voltage, which reflects SoC but not SoH. Voltage alone cannot detect capacity degradation. A load test or controlled discharge with a battery monitor is required for accurate health analysis.
What SoH percentage means my battery needs replacement?
Most manufacturers and warranties set 70% SoH as the end-of-life threshold. At that point, the battery delivers less than 70% of its original storage capacity, which reduces backup runtime and solar self-consumption measurably.
What causes SoC drift and how does it affect test results?
SoC drift occurs when the battery monitor loses accurate tracking of charge cycles, causing the displayed charge level to diverge from actual capacity. Running a full reference discharge cycle resets the counter and separates real degradation from a calibration error.